Why C$50 per week?
Most people do not invest a large lump sum at exactly the right time. A more realistic approach is to save
a fixed amount from each paycheque or each week. This is called dollar-cost averaging (DCA).
When prices fall, C$50 buys more units. When prices rise, the same C$50 buys fewer units.
DCA does not remove market risk and it does not guarantee a profit. What it does is remove the need to make
one perfect market-timing decision. The discipline is in continuing to contribute through both strong and
weak markets.
What this comparison illustrates
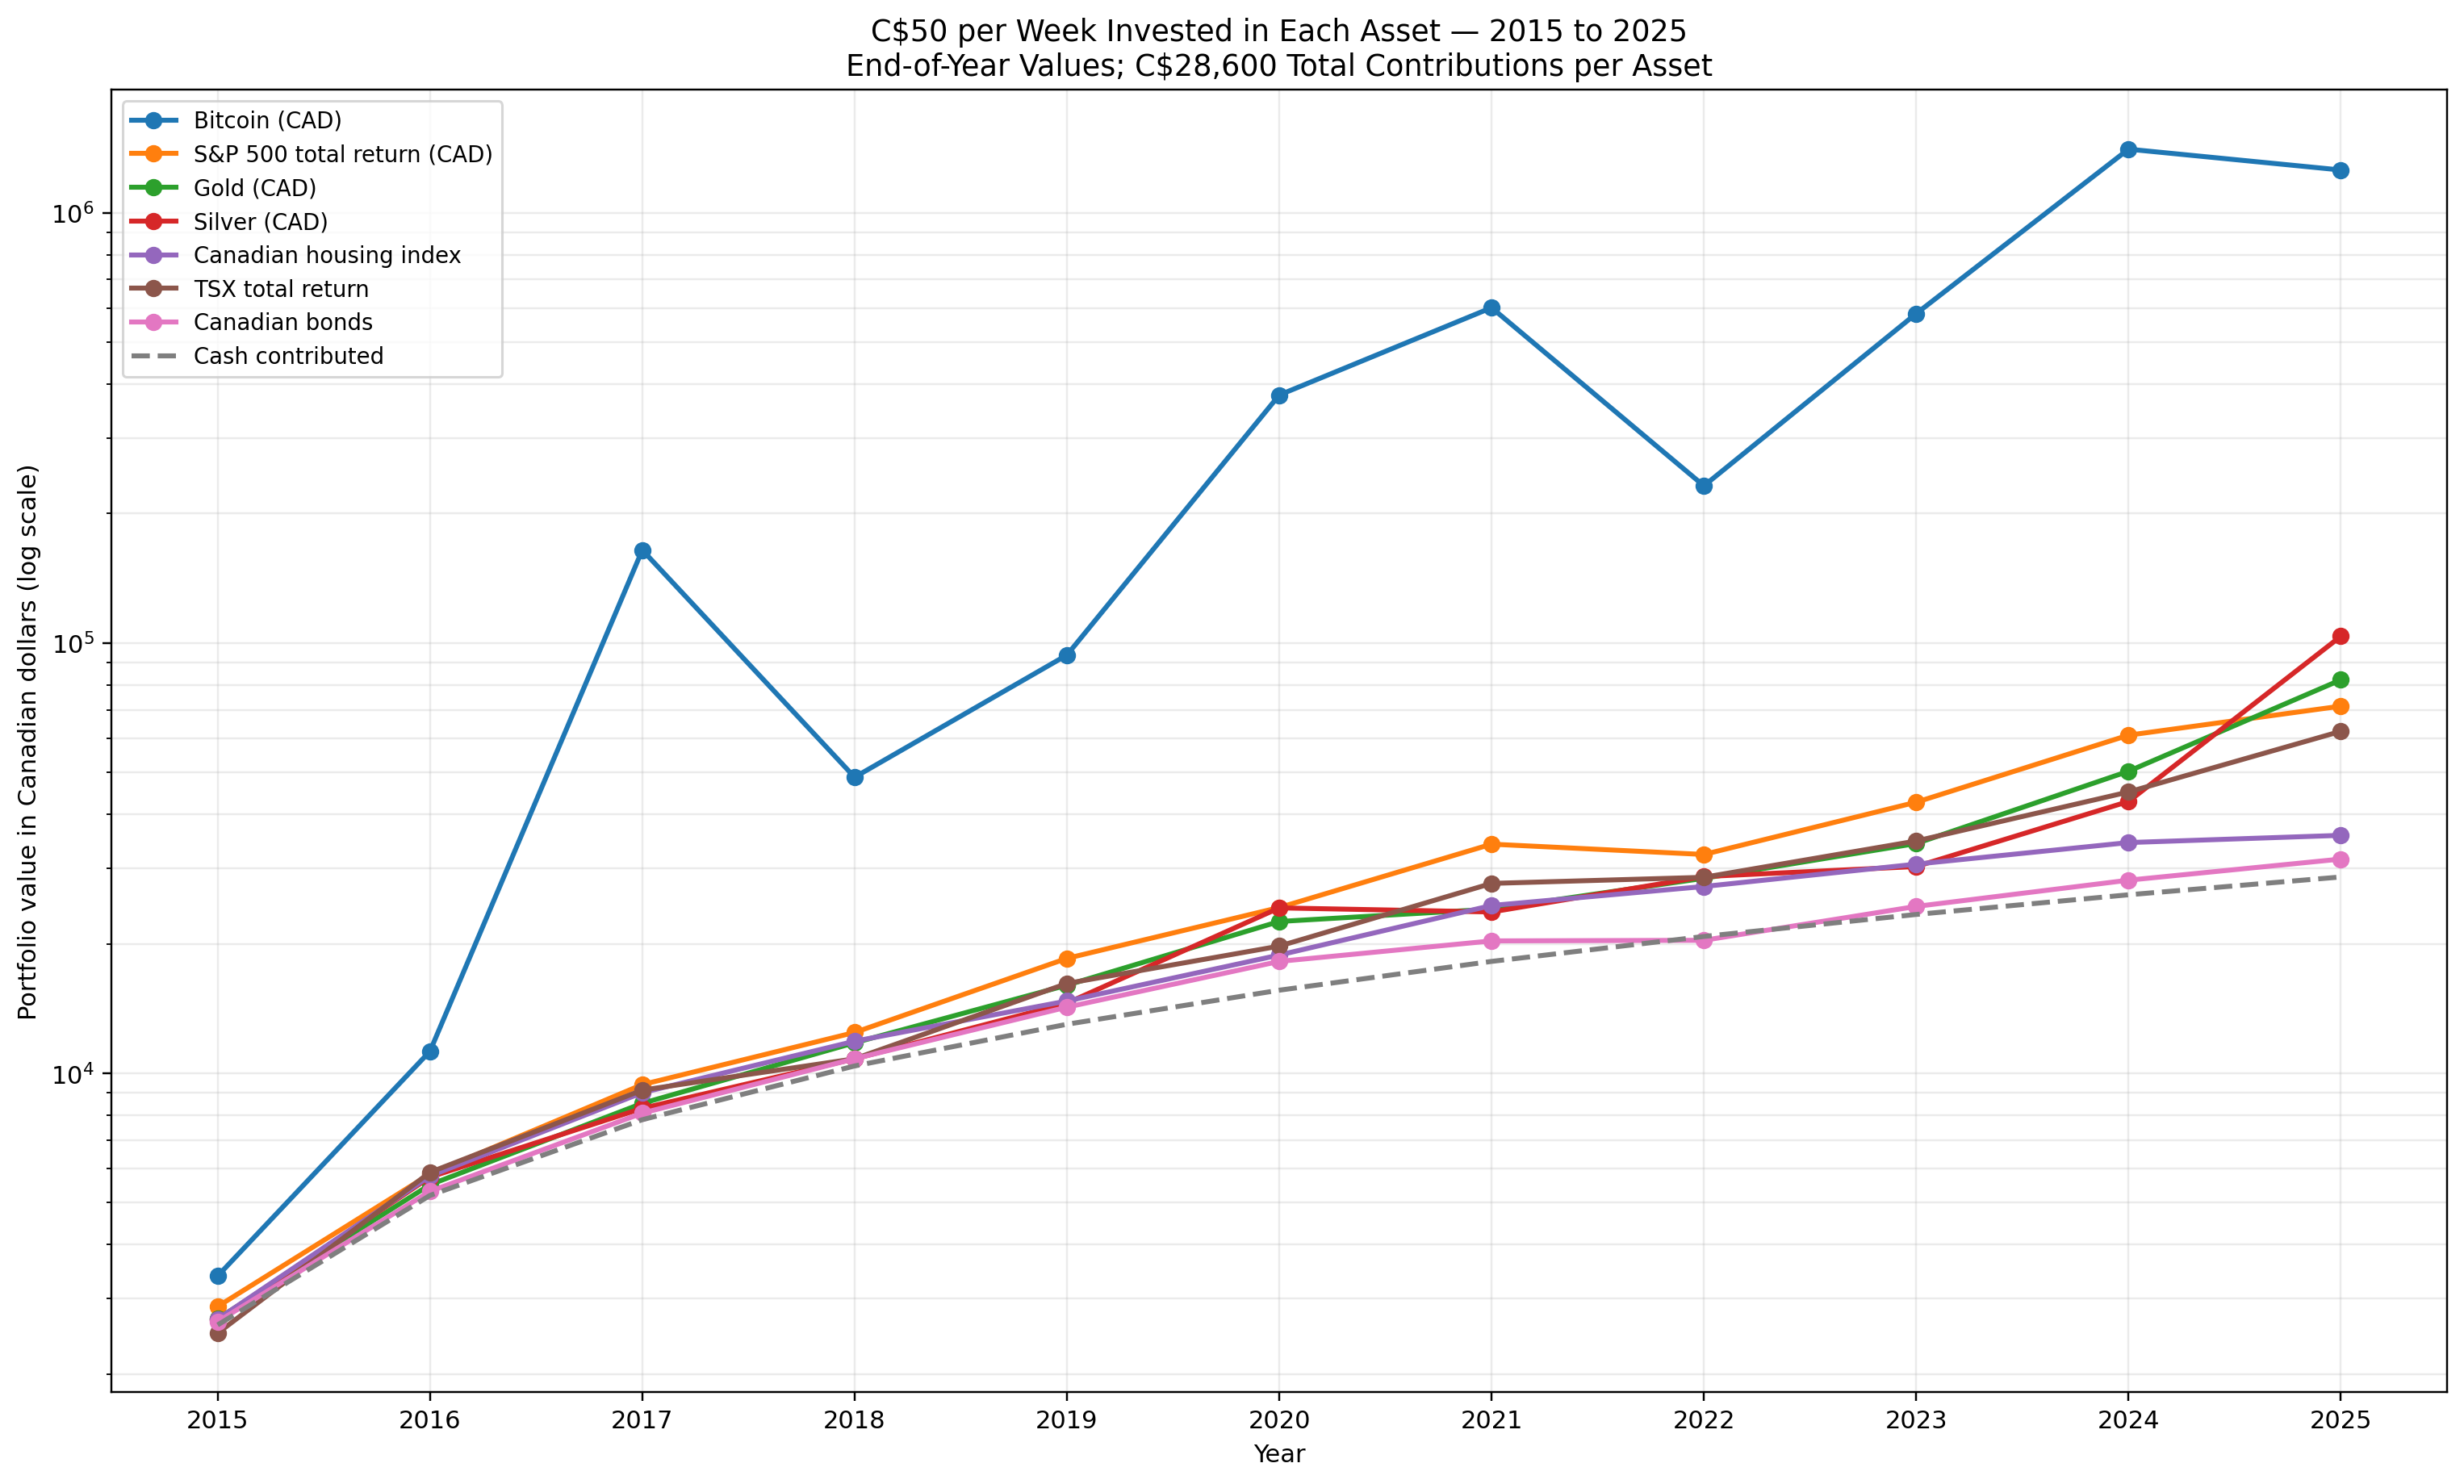
Over this particular 2015–2025 period, the results were dramatically different even though every series
received exactly the same C$28,600 of contributions. Bitcoin produced the largest ending value, but it also
experienced severe drawdowns. Silver and gold finished strongly, while broad stock indexes compounded more
steadily. Bonds and the housing price index showed much smaller growth in this simplified comparison.
The lesson is not that one asset will always win. It is that return, volatility, timing and the order
of gains and losses matter greatly when money is added gradually over many years.
Approximate value at the end of 2025
Each line received the same C$28,600 in total contributions.
| Investment |
Total contributed |
End-2025 value |
Gain above contributions |
Ending value / contributions |
| Bitcoin (CAD) |
C$28,600 |
C$1,258,490 |
C$1,229,890 |
44.00× |
| Silver (CAD) |
C$28,600 |
C$103,730 |
C$75,130 |
3.63× |
| Gold (CAD) |
C$28,600 |
C$82,147 |
C$53,547 |
2.87× |
| S&P 500 total return (CAD) |
C$28,600 |
C$71,366 |
C$42,766 |
2.50× |
| TSX total return |
C$28,600 |
C$62,366 |
C$33,766 |
2.18× |
| Canadian housing index |
C$28,600 |
C$35,737 |
C$7,137 |
1.25× |
| Canadian bonds |
C$28,600 |
C$31,477 |
C$2,877 |
1.10× |
Important methodology note: this is a comparative model, not a transaction-by-transaction brokerage statement.
Published annual returns were converted to equivalent compounded weekly rates, and C$50 was added during each modeled week.
This preserves each calendar year's return while providing a consistent weekly-contribution comparison across all seven series.
Disclaimer — not investment advice
This page is provided for educational and historical comparison only. It is not financial, investment, tax, legal
or accounting advice, and it is not a recommendation to buy or sell Bitcoin, precious metals, stocks, bonds, real
estate or any other asset. Historical returns do not predict future results. Bitcoin and other investments can be
highly volatile and can lose substantial value. Taxes, fees, spreads, custody costs, fund expenses and individual
circumstances can materially change real-world results.
Before making an investment decision, consider your objectives, time horizon, liquidity needs, tolerance for loss
and, where appropriate, obtain advice from qualified professionals.