The experiment: C$50 every week
C$50invested each week into each asset
312 weeks52 modeled weeks × 6 calendar years
C$15,600total contributions into each investment
The user requested the period “2020 to the end of 2025.” That is six complete
calendar years when both endpoints are included. Each asset therefore receives
the same C$15,600 of contributions.
The calculation is a consistent DCA model, not a literal trade-by-trade weekly
backtest. Each published calendar-year return is converted to an equivalent
weekly compound return, and C$50 is added at the start of each modeled week.
That preserves each year's published return while treating every investment consistently.
2020–2025 DCA chart
A logarithmic vertical scale is used because Bitcoin's growth would otherwise compress
the conventional investments into a narrow band near the bottom of a normal linear chart.
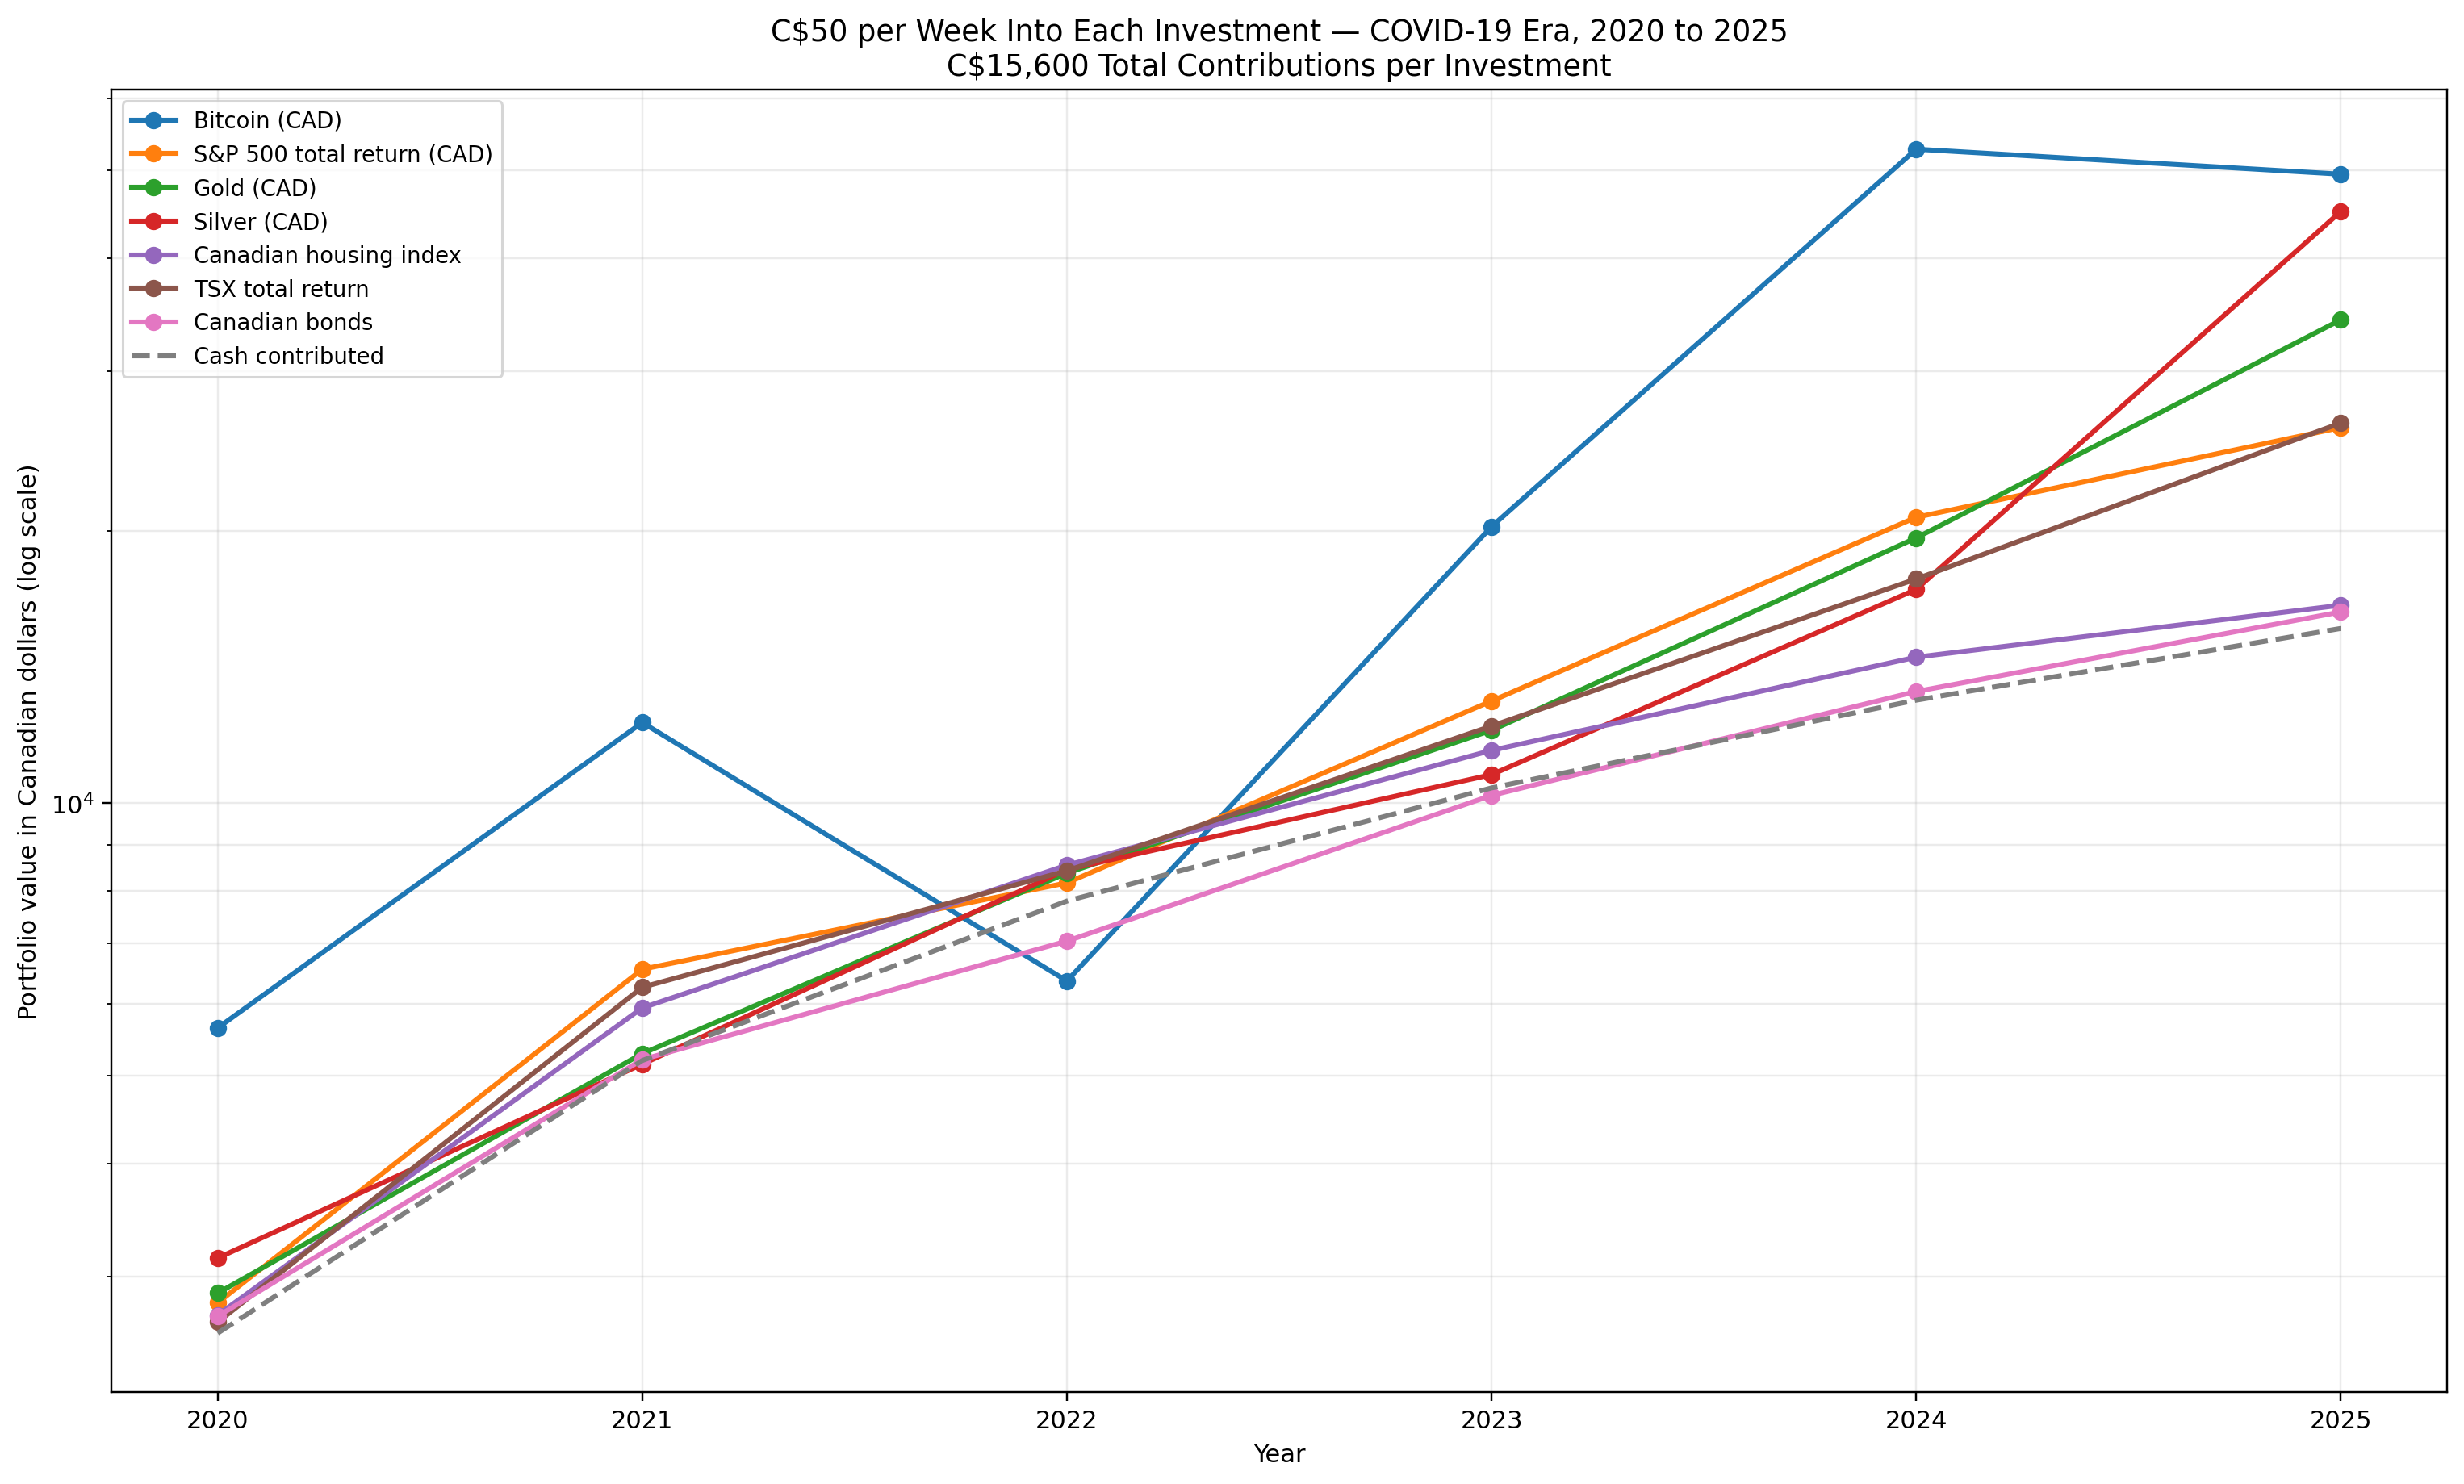
Where C$15,600 ended up by December 2025
The purpose of this comparison is not to claim that the best-performing asset was
obvious in advance. It shows what disciplined, repeated purchasing can do when an
investor continues buying through crashes, recoveries, inflation, rate increases and
periods of extreme volatility.
COVID-19 changed the economic environment
COVID-19 caused an abrupt global shutdown and a severe market shock in early 2020.
Governments responded with extraordinary fiscal programs to support households,
workers and businesses. Central banks separately cut interest rates, created liquidity
facilities and purchased large quantities of bonds and other eligible securities.
It is common to describe this period as governments “pumping money into the markets,”
but that wording mixes together two different policies. Fiscal stimulus
put money and credit support into the economy, while central-bank monetary policy
lowered financing costs and added liquidity to financial markets. Both could influence
asset prices, but not every dollar of government support went directly into stocks,
Bitcoin, gold or housing.
2020 — crash, emergency support and massive liquidity
Canada committed more than C$345 billion in its COVID-19 Economic Response Plan.
The Bank of Canada cut its policy rate to 0.25% and began Government of Canada bond
purchases at a minimum of C$5 billion per week. Similar emergency policies were
adopted throughout the G7.
United States — very large Federal Reserve purchases
The Federal Reserve ultimately maintained purchases of about US$80 billion of
Treasury securities and US$40 billion of agency mortgage-backed securities per month.
Its balance sheet rose from roughly US$7.4 trillion at the end of 2020 to nearly
US$8.5 trillion by September 2021.
Europe and the United Kingdom
The European Central Bank expanded its Pandemic Emergency Purchase Programme to a
€1.85 trillion envelope. The Bank of England maintained a total asset-purchase target
of £895 billion by late 2020. These were exceptionally large interventions designed
to stabilize financing conditions during the pandemic.
2021 — reopening and asset-price strength
Extremely low interest rates, fiscal transfers, recovering earnings, restricted
consumption during lockdowns and abundant liquidity coincided with strong gains in
many financial and housing markets. Bitcoin also experienced very large price swings.
2022 — inflation and the reversal
Inflation accelerated and central banks changed direction. Interest rates rose quickly,
bond prices fell, growth stocks weakened, housing cooled and Bitcoin suffered another
major drawdown. A DCA investor continued buying through that decline instead of needing
to guess the market bottom.
2023–2025 — recovery, divergence and new highs
Markets did not recover uniformly. Equities, Bitcoin and precious metals had very
different paths, while Canadian housing and bonds behaved differently again. That
dispersion is exactly why a DCA comparison is informative: the same contribution
schedule can produce dramatically different outcomes depending on volatility and return.
Why DCA matters in a crisis
Dollar-cost averaging removes the requirement to make one perfect market-timing decision.
When an asset falls, the same C$50 buys more units. When it rises, the same C$50 buys fewer.
The investor keeps accumulating through both fear and optimism.
That does not make DCA risk-free. If an asset permanently declines,
repeated purchases can simply add more money to a losing investment. DCA is a contribution
discipline—not a guarantee of profit and not a substitute for diversification, valuation,
risk management or suitability.
Important methodology notes
- All values are shown in Canadian dollars or use Canadian-dollar annual returns.
- S&P 500 and TSX figures are total-return series, so dividends are included.
- Bitcoin and precious metals are price-return assets; no dividend is assumed.
- The Canadian housing line tracks house-price appreciation only. It does not include rent, mortgage leverage, property tax, insurance, maintenance or transaction costs.
- Canadian bonds use a broad Canadian bond total-return series.
- The chart assumes 52 equal C$50 contributions per year and ignores trading costs, taxes, spreads and custody costs.
Sources and further reading
Disclaimer — not investment advice
This page is for educational and historical discussion only. It is not financial,
investment, tax, accounting or legal advice and is not a recommendation to buy, sell
or hold Bitcoin, precious metals, securities, real estate, bonds or any other investment.
Historical returns do not predict future returns. Bitcoin and other investments can be
highly volatile and can lose substantial value. Data can differ among providers because
of pricing times, benchmarks, exchange rates and methodology. Verify important figures
independently and consider professional advice appropriate to your circumstances.